How We Made the Deno Language Server Ten Times Faster
Programming should be simple, which is why we built Deno to be “batteries
included” with all-in-one tooling,
native TypeScript support,
and
web standards APIs.
(You can get started with TypeScript just by naming a file with a .ts
extension.) One major way Deno boosts productivity is through our
language server,
which offers auto-completion, tooltips, linting, code formatting, and more.
Recently, a customer reported significant performance issues with our language server in large codebases. Their feedback led us to investigate and optimize our language server, resulting in a dramatic reduction in auto-completion times - from 8 seconds to under one second. This blog post details how we achieved this improvement, from identifying the problem to implementing the solution.
This blog post goes over the process of improving our language server performance:
- “We’re having problems”
- High level overview of an LSP
- Improving observability
- Flamegraphs
- Optimizing
- Results
- What’s next?
“We’re having problems”
When one of our customers told us that our language server was impeding their development speed, we knew we needed to investigate.

This customer provided details about their repo, the machine they’re using, and more, to help us reproduce the issue and start investigating. Within minutes, our team created a dedicated Slack channel and began pooling notes and ideas about next steps.
But before we dive into our investigation process, how exactly does a language server work?
High-level overview of an LSP
Language server protocol (“LSP”) is a standard interface between a text editor and a language server to offer auto-complete, go-to definitions, documentation on hover, and more.
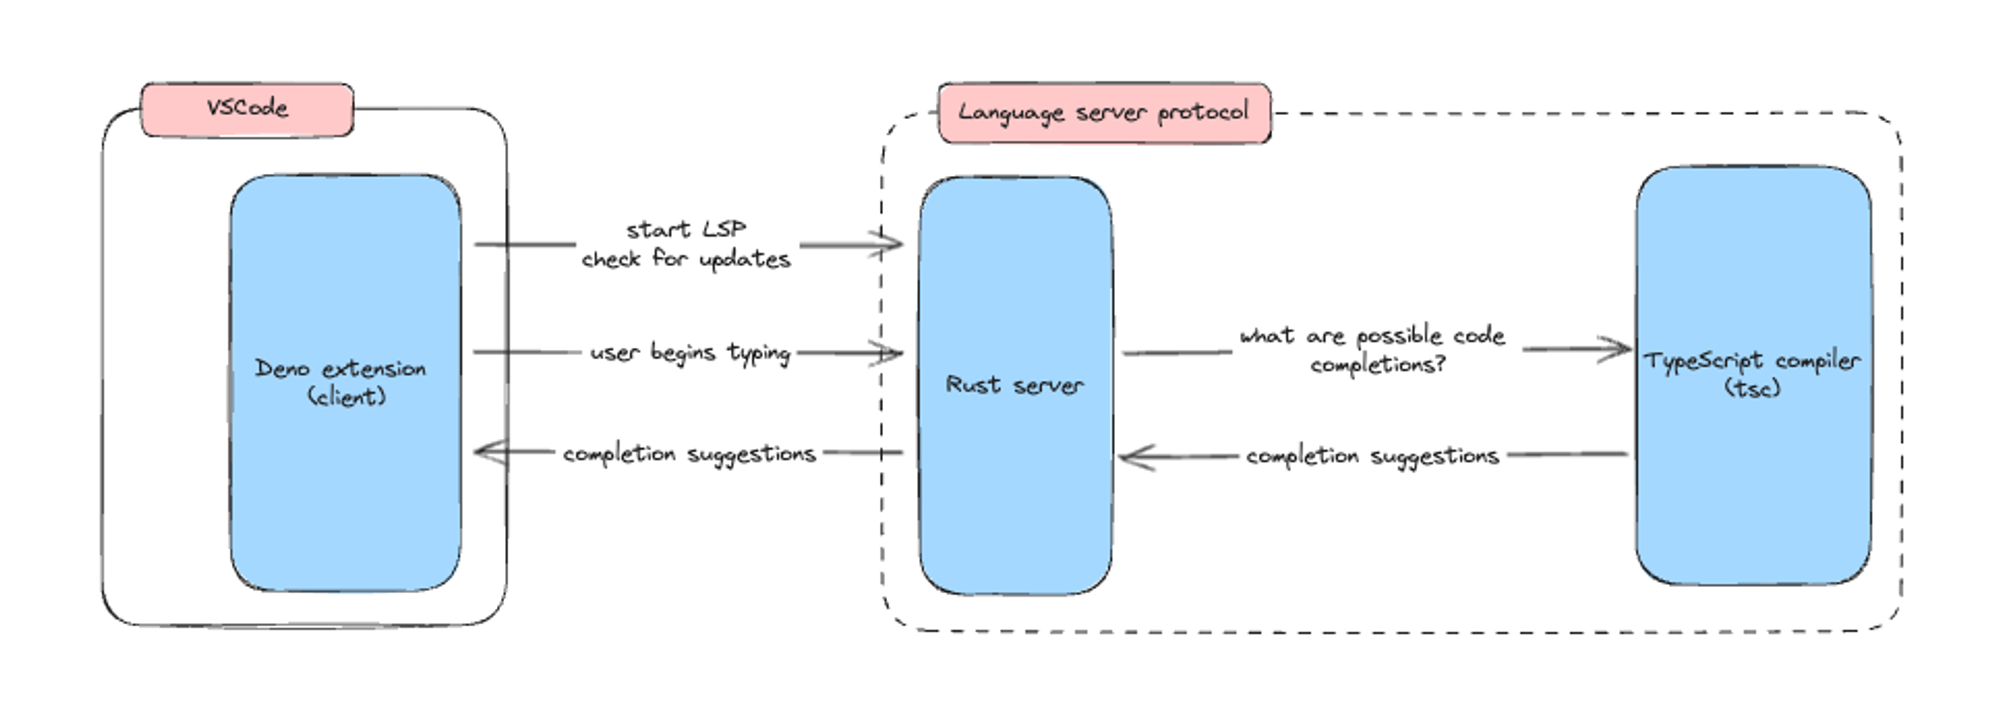
Our language server is written in Rust and uses tsc , a TypeScript compiler,
to analyze the TypeScript files in a user’s editor. This means the editor’s Deno
extension (e.g.
the VSCode Deno extension)
will talk to the Rust server, which will then pass things back and forth with
tsc, and then finally respond to the extension with auto completion
suggestions, documentation, etc.
With this high-level understanding of our language server, we can now dig into our investigation to improve performance.
Improving observability
Performance is important for our all of our projects. Anytime a PR is submitted, our CI/CD automatically runs key benchmarks on it to measure its impact on performance. Ideally, the set of benchmarking measurements is comprehensive enough to meaningfully cover “real world” scenarios.
While we already had some logging in deno lsp, we needed more thorough
benchmarks. However, it’s difficult to benchmark in the conventional sense —
language servers are so interactive and there are a million different ways that
a user could use it. Coming up with a comprehensive set of benchmarks that is a
good representative of what most users will experience would be difficult.
Fortunately, for this particular investigation, we also knew the conditions in which our customer was running into performance issues. They were in a very large code base, which had over 75k lines of TypeScript code and over 750k lines of TypeScript in dependencies. We created a benchmark that covered this use case — it mocks a series of API calls to the language server that mimicked a user clicking around files in a huge code base. This helped us quickly assess the performance impact of a PR with respect to the customer’s specific use case.
In addition to this benchmark, we added instrumentation to the language server so we can get a sense of resource usage over time, which generated flamegraphs to help us narrow down in our code base where resources may be inefficiently used.
Flamegraphs
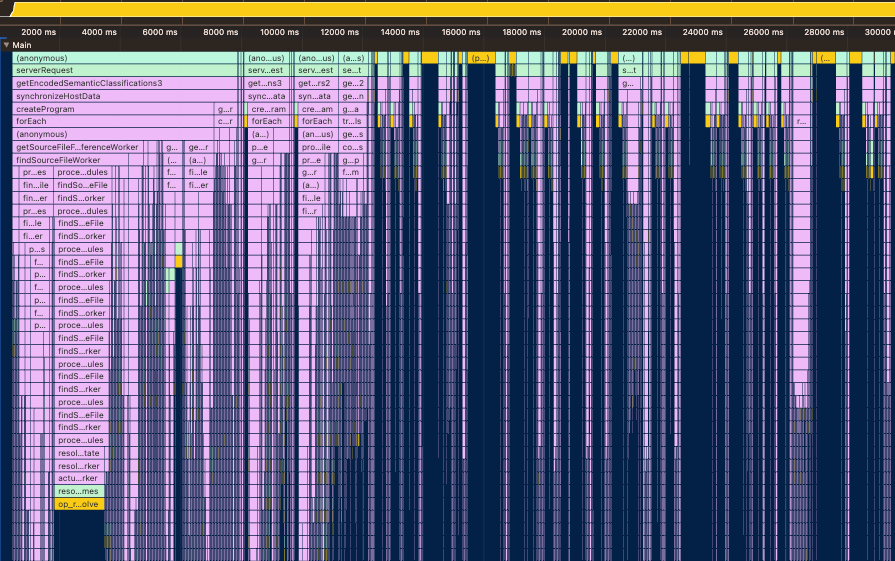
Flamegraphs are a type of chart that helps visualize a stacktrace. It helps with identifying where time is being spent in a given call stack. This makes it easy to see what functions are unexpected bottlenecks for a given operation.
When reading a flamegraph, each “segment” represents a function call. The X-axis is execution time (so the wider a segment is, the longer that function call is taking to execute), and the Y-axis is call stack depth (so when a function calls another function, it will have a segment beneath it).
We record two flamegraphs from the language server: one from Rust, and one from JavaScript. The flamegraph generated from Rust, we feed into Jaeger, while the one generated from JavaScript, we can open in chrome dev tools.
Here’s what we saw on the JavaScript side:
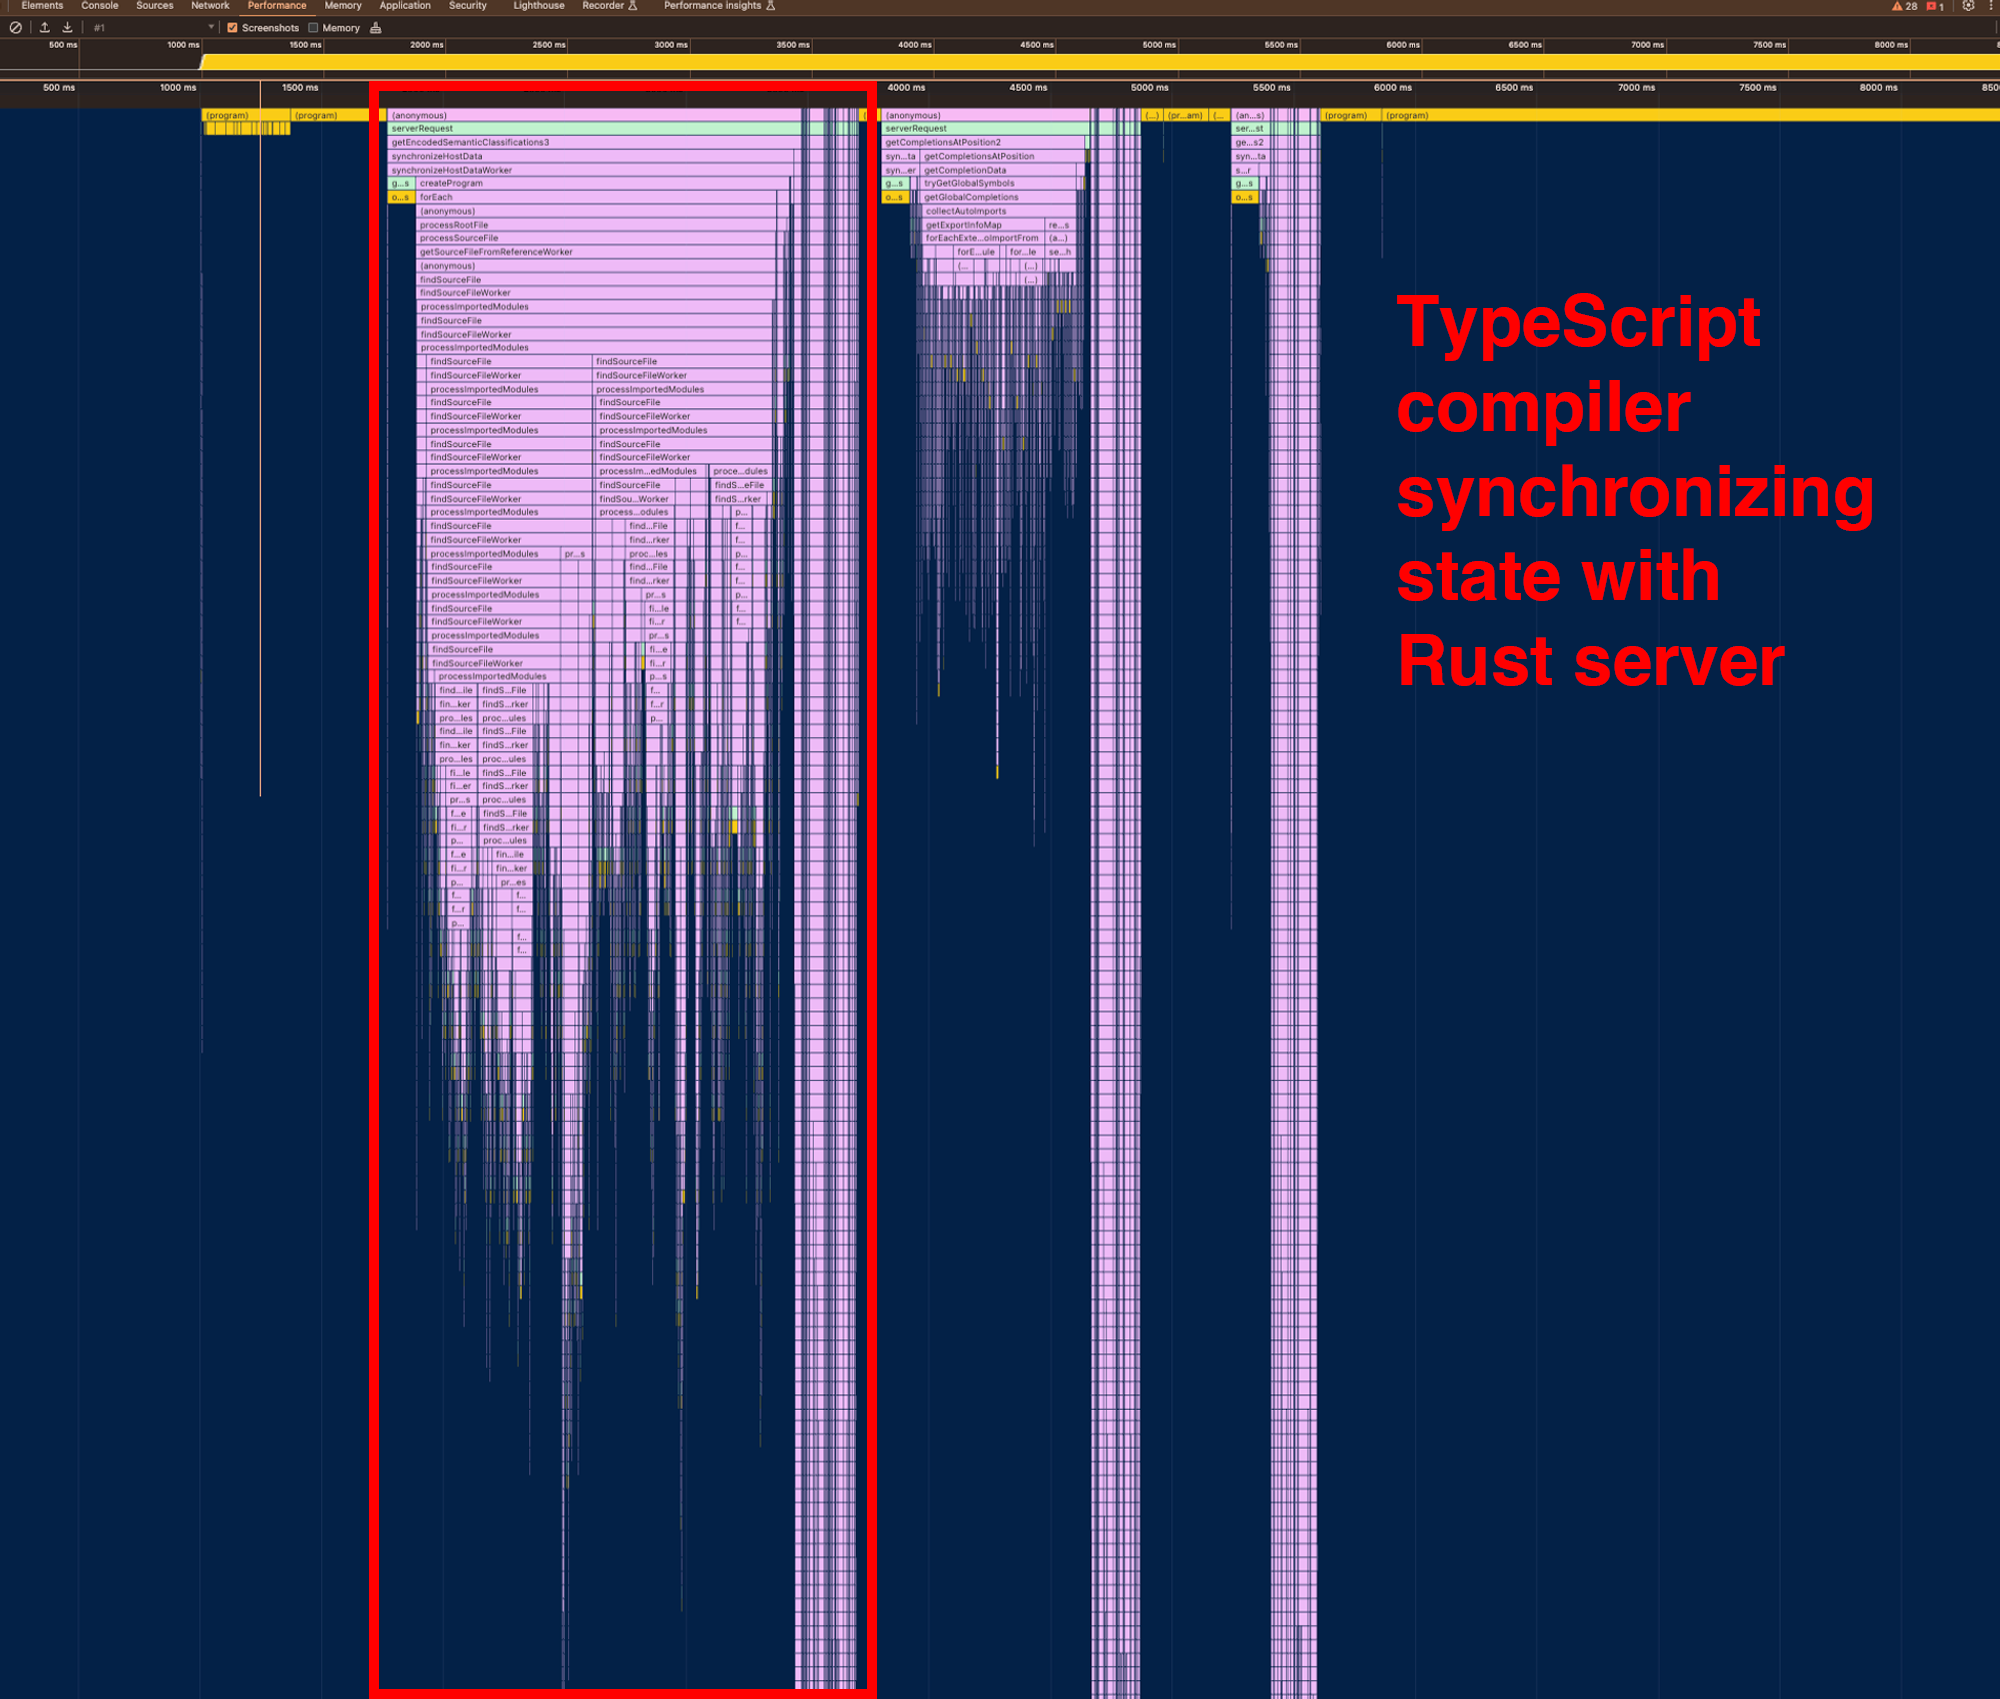
The yellow represents our Rust code, the green our JavaScript code, and the purple the TypeScript compiler.
The first wide purple segment (marked in red) represents the process where the TypeScript compiler is asking the Rust server for all of the contents of the files to synchronize the state of the project. The purple sliver to the immediate right is the actual work — returning autocomplete suggestions, for instance. This flamegraph indicates that the process of synchronizing state takes way too long, so the focus of our performance work became reducing that segment’s width as much as possible.
Optimizing
Before we dive into the fix, let’s go into more detail about how our Rust server
interfaces with tsc.
In order to provide accurate auto-completions, documentation on hover, et al.,
the TypeScript compiler contains an up-to-date model of the live code base that
the user is working in. To maintain a real-time model of the code base in tsc,
anytime the Rust server asks it for auto-complete suggestions, it asks the Rust
server for latest versions of all the files in the codebase, and stores that
into memory.
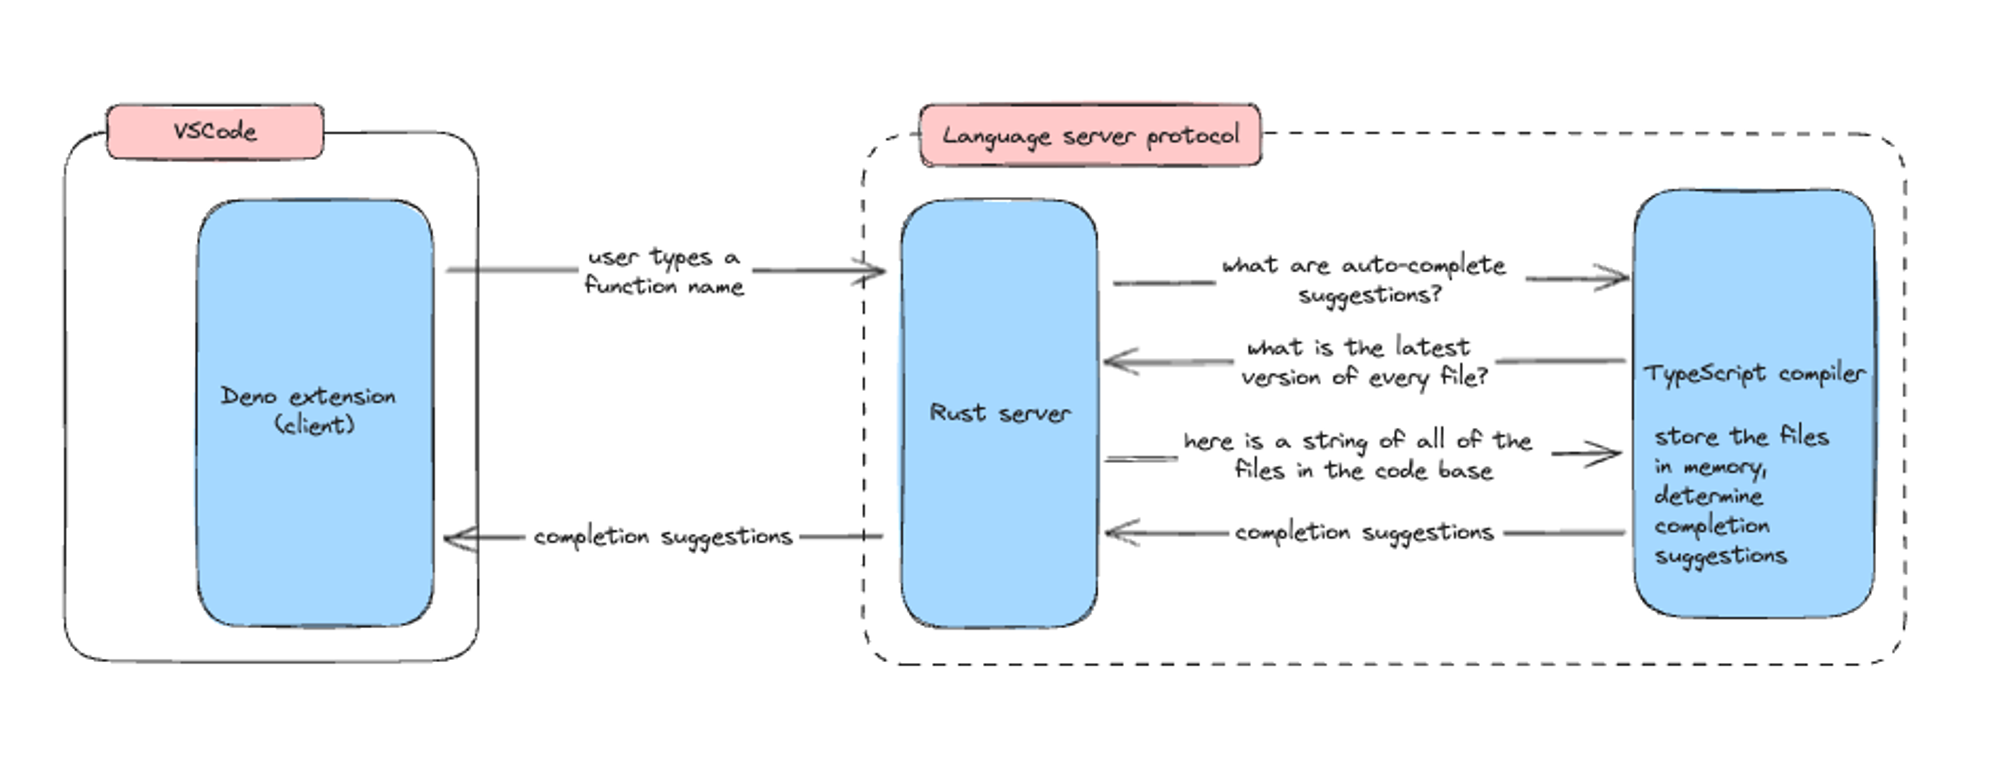
Reading over 100k lines of code (including dependencies) each time a user hits a keystroke seems like a massive, unnecessary use of CPU. Passing text from Rust to JavaScript is expensive and we needed to find a way to minimize that.
From this discovery, our team made several PRs, targeting either:
- reducing the number of files the TypeScript compiler has to ask the Rust server about
- making operations requested by the TypeScript compiler (module resolution, for instance) faster
- being smarter about caching unchanged files to reduce the cost of synchronization
Reducing the number of files to send to the TypeScript compiler
Before, the TypeScript compiler would ask for the latest version of all of the files. This includes dependencies, and their dependencies. Well, surely not all files are needed, right? Some of them definitely aren’t changing all the time.
We decided to update the TypeScript compiler to only ask for the latest version
of the files that are local. The reason is that if someone imported remotely,
e.g. via npm: , jsr: , or a URL, those dependencies are cached locally and
most likely won’t change.
Making the interface between tsc and Rust more efficient
Previously, we were storing the files in the TypeScript compiler’s memory and each time it asked for the latest version of every single file in the code base.
Previously, we had to frequently call into Rust to request information about
files, such as their latest versions and the actual source text. Calling into
Rust from JavaScript, especially passing data between them, is fairly expensive.
This meant that requests from tsc what should be relatively quick to answer
(e.g. what is the latest version of this file?) were taking much longer than
expected. As code bases get larger, since the overhead is multiplied by the
number of files and dependencies within the project, the act of synchornizing
with tsc becomes more resource intensive than the actual computation by tsc.
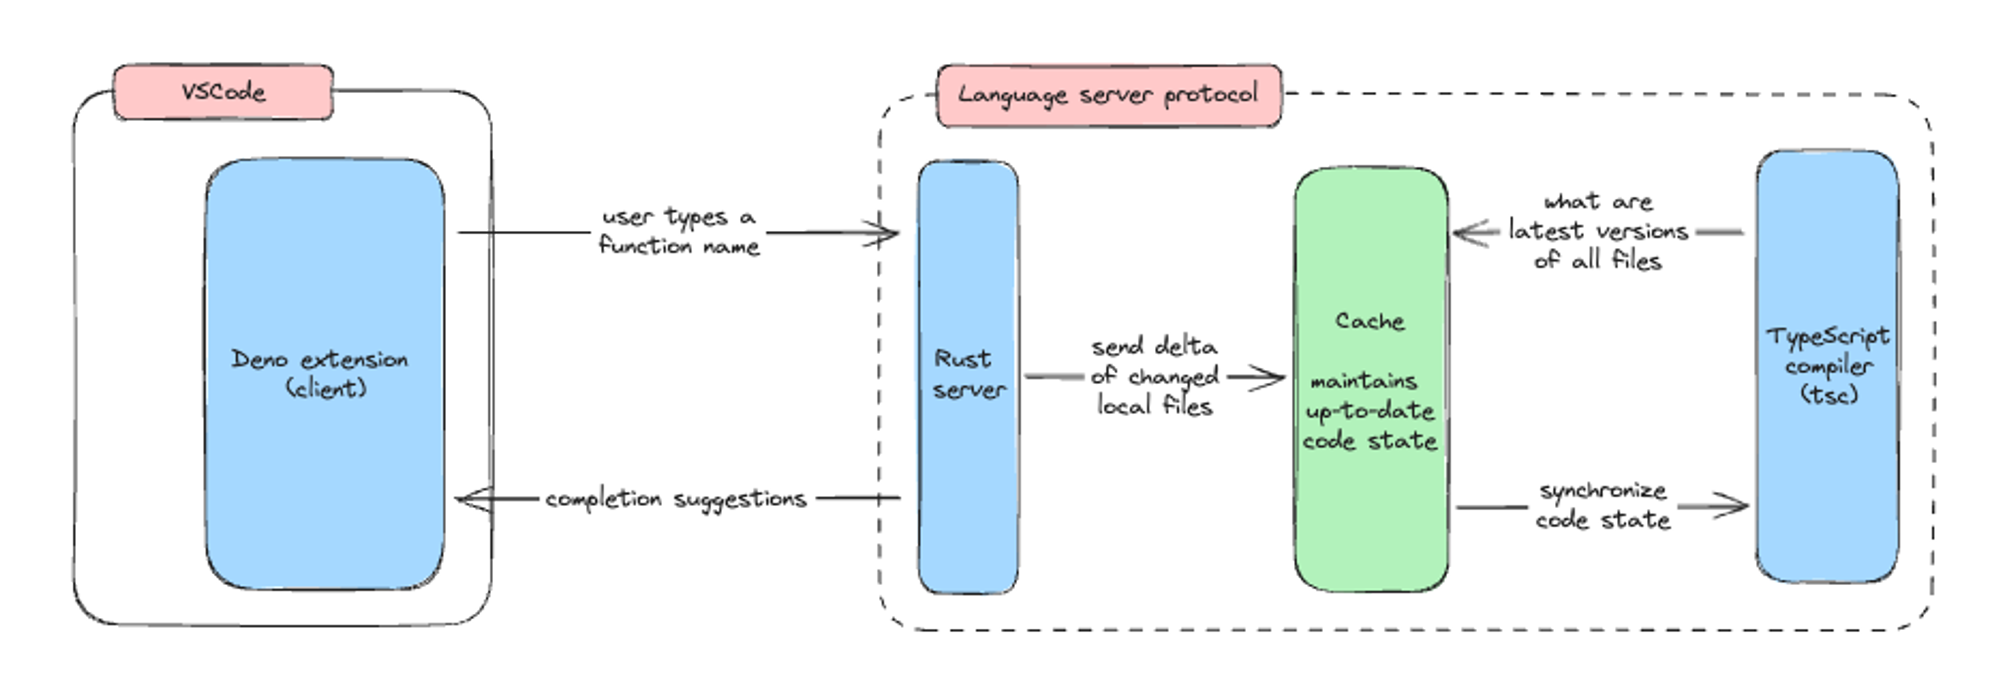
First, we decided to introduce a cache layer between Rust and tsc, where the
project’s state is stored. Whenever tsc asks for some information, we want the
answer to come from a cache as much as possible. As with all caching, it’s
important to track when the cache is up-to-date. Using a stale cached value can
cause incorrect responses and provide the user with faulty suggestions or
incorrect diagnostics. To avoid this, we added a mechanism for the Rust server
to notify the JavaScript interface of file changes, so that it can evict only
values that may have changed from the cache. This maximizes the cache usage
while still giving up-to-date responses.
The cache layer dramatically reduced the need for passing data between Rust and
tsc. Now, when tsc asked for information, the values were already stored in
the JavaScript layer, which means it’s just passing a pointer around with no
copying or calls into Rust needed.
Results
With the release of 1.43, we were thrilled to announce all of the performance improvements we made with the language server.
Here’s the flamegraph of our language server before our optimizion efforts:
And here’s an updated JavaScript flamegraph from 1.43:
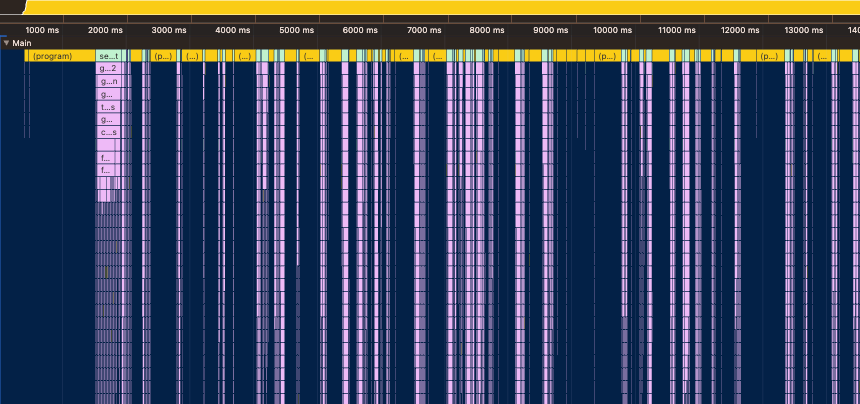
That large purple segment on the left side is much narrower here, suggesting that we eliminated the time it takes for the state synchronization process between Rust and the TypeScript compiler.
Our customers were thrilled as well:

What’s next?
Deno aims to simplify programming. Using Deno with our language server makes building software more intuitive and productive, as you can pull auto-complete suggestions, documentation, type definitions, and more right in your text editor. Our performance optimizations here made our language server faster in large code bases.
Thanks to our customer who let us know about their issues, we were able to address it within a single release cycle. So yes, your feedback is important to us — we take it seriously and are committed to delivering the highest quality software for our users. If there are any other bugs or feature requests, please let us know in GitHub or Discord.
🚨️ Do you use Deno in production at your company? 🚨️
We’d love your feedback. Fill out this survey and if we speak with you, you’ll earn free Deno merch.


